
Understanding Momentum indicators and RSI
 Understanding Momentum indicators and RSI
Each book on the topic Technical Analysis contains at least a couple of chapters that discuss both momentum and relative strength index (RSI). For those who do not know the price momentum and RSI, you should know that J. Welles Wilder (who created the index at the end of the 1970s) first wrote about the subject in classical ” New Concepts in Trading Systems “. His book can help you understand Momentum indicators and RSI, but we must make a djukdykning the subject of this artikell
To understand how these two indicators can be used, we must first examine them individually and understand them.
Momentumindikatorer
Momentum measures the speed or rate of change in price. I “Technical Analysis of the Financial Markets” explains John J. Murphy: “Momentum is measured by continuously check price differences for a predetermined time interval. To construct a 10-day momentum line, you subtract the closing price of 10 days ago from the last closing price. This positive or negative value is then plotted around the zero line. The formula for momentum is:
M = V – Vx
V is the latest price and Vx is the closing price x number of days ago. ”
Momentum measures the rate at which the stock price rises or falls. From the trend respects momentum is a very useful indicator of strength or weakness in the share price. History has shown us that the power is much more useful in rising markets than in falling markets. The fact that the markets rise more often than they fall is the cause of this. In other words, bull markets tend to last longer than bear markets.
RSI
RSI, Relative styrkeindexet or The relative strength index, edited by J. Welles Wilder Jr. in the late 1970s; hans ” New Concepts in Trading Systems” (1978) now is an investment classic. On a chart, assigns RSI share a value between 0 and 100. When these figures are kartläggda, analysts compare them to other factors, as in bought or sold values. To achieve the best evaluation chart experts generally RSI on a daily time frame instead of every hour. Sometimes mapped However, shorter periods to indicate whether it is a good idea to do a short-term buy.
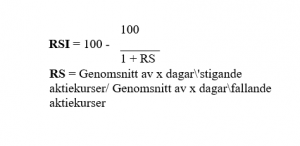
There has always been a little confusion over the difference between the relative strength, measuring two separate and different units by means of a relative line and RSI, indicating the trader whether a stock price change created by those who bought or sold over the. The well-known formula for the relative strength index is the following:
 At the bottom of the RSI chart regarded settings at 70 and 30 the values, the standards serve as clear warnings of the respective overbought and oversold assets. A trader can with today's simple programs can restore indicators' parameters 80 and 20. It helps stock investors to be sure when he makes the decision to buy or sell a stock and do not squeeze the trigger too fast.
In the end, RSI is a tool to determine the low probability and high reward preferences. It works best in comparison with the short-term overall overall transfers. By using a 10-day moving average with a 25 day moving average, you discover that the transitions that indicate a variety of direction will occur very close to the times when the RSI is either 20/30 or 70/80 times when it shows different over either bought or sold over readings. In simple terms, RSI is predicting almost anything an upcoming reversal of a trend, either up or down.
An example
Both indicators are very reliable on their own, but what would happen if we decided to put the two together? The result gives even better time with our input- and points. Let's take a look.
In the first chart, we have set a momentum indicator with a 12-day period. In the second chart, we compare the share during the same time frame and add the RSI indicator on the bottom of the space. RSI in this example also relates to a 12 day period.
The first glance shows that the share that the momentum is rising above the zero line for the first week in December. We have demonstrated this on the chart with blue up arrows. This input signal is not durable, because the torque return a week later and leads south to end the year at about $ 22-level, shown with red downward arrows. Next entry level is not seen until the first week of February 2003. This is shown again with the blue up arrows. For the most part falls torque is not the zero line with any conviction of the week until the week of 23 June. During this time moved the share price from $ 21-level to the last level $ 32,47.
 The second glance, as visarRSI indicator, have a slightly different appearance from the momentum diagram above. First and foremost, it is a weak point in early January and then a few weeks later, a slightly stronger entry point, which for the most part continues throughout the winter and into the spring. You can look for the blue arrows (entry points) we have drawn at the beginning of the year, there are three sets of red downward arrows (starting points) in mid-March, again during the second week in May and again in the third week of June.
It is important to remember that many traders see the RSI value of 50 as support- and motståndsmål. If the stock price is difficult to break through the 50-value level, resistance may be too high at that time and the share price could fall again until there is enough volume to break through and proceed to new levels. A shares falling in price could find support around the 50-value and bounce off this level again to continue an upward price increase.
 The point
This study of the share price shows an interesting look that traders should consider when using oscillators for the- and points. In the second diagram reflects the weak point of entry at the beginning of January, not even a buy signal in the first graph, using momentum. In summary, traders should ignore the input signal. The second input signal was issued a few weeks later by the RSI confirmed a week later with a strong buy signal from the momentum indicator that rises above the zero line.
Another important note is that although there are three sell signals displayed on the RSI chart, confirms the momentum sell signals, and the stock continues to rise, short-lived gains. Sell signal in the RSI chart for the third week in June, confirmed by the momentum indicator, while falling sharply and falls below the zero line.
Double confirmation of purchase- and sell signals give traders a better understanding of whether they are in or out at the right time. And timing is everything in this game.